These are just my independent observations, so it's neither fake news nor Russian Propaganda... it's just data I've looked at because I was curious.
M2 Money Supply vs Inflation
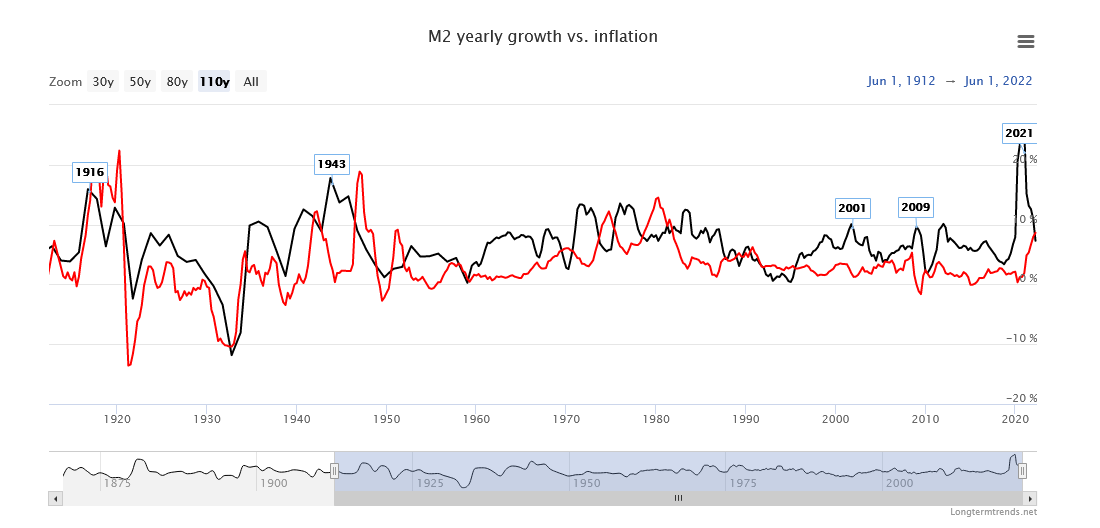
In the past, high levels of inflation have lagged increases in money supply by about 4 years. In the past, these huge peaks were met with inflation at a rate comparable to the increase in M2. If we assume this could be the case, since our peak of currency creation was 2021, around 2025 would roughly be our peak of inflation. We're just getting started. But...
This is not a hard and fast rule - the inflation rate is not a simple time shift of the M2 rate. We had "local maximums" in 2001 and 2009 recessions. Creating currency to boost a failing economy doesn't always lead to price inflation, but in the 2000s it did lead to asset price inflation. In those years we lowered interest rates to provide the cheap money as we needed it to stimulate the economy. But as a result, we've got a lagging inflation rate as those prices (the cost of living) seep into the rest of the economy, not just housing.
So will this time be comparable to 1975/1980 recessions, or will this be another 2001/2009 recession? What was different?
In my opinion, we're more likely to have a 1975/1980 type recession - in 2001/2009 we were lowering interest rates to "print money" as inflation was coming down. This time, we've got asset price inflation and a lag in inflation, from "artificially low" interest rates. The only "cure" for out of control inflation is interest rate rises.
Historic Interest Rates
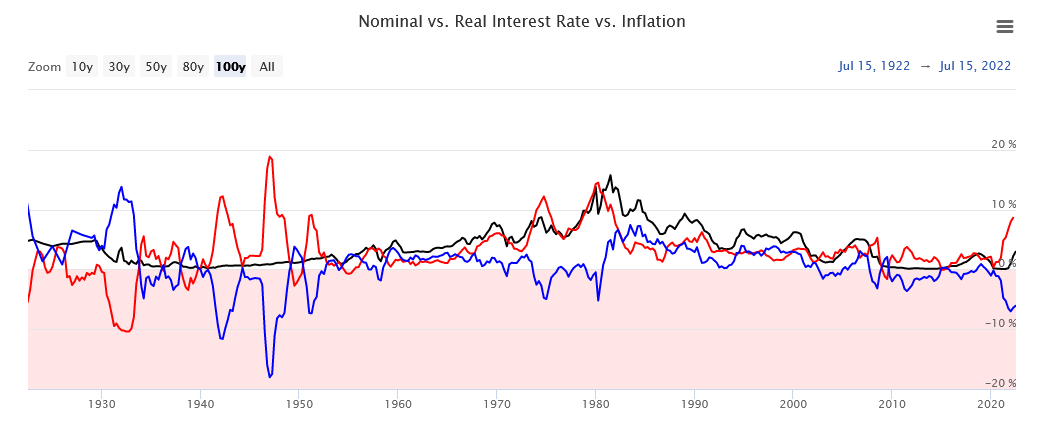
Interest rates in the past (eg the 80s) had to rise higher than inflation to tame it.
If we've got the most currency creation we've ever seen (more than First and Second World Wars) at a peak of 27%, and a lagging inflation, we could possibly see the highest inflation we've ever seen (27%?), and therefore the highest interest rates we've ever seen (27%?). Asset prices (specifically homes) are roughly
twice as expensive as an inflation adjusted median. These need to come down for stability.
So we really need house prices to cut in half, interest rates to go through the roof, and high inflation to soak up the excess money supply. 1975 and 1980 were periods of stagflation - high inflation with high unemployment and high interest rates. 2001/2009 were low inflation, low interest rates and high unemployment.
I would say the order is: higher prices, higher interest rates, higher unemployment, war.
Note that 1975 and 1980 were "twin peaks"... whatever they did in 1975 didn't work, and inflation (and money printing) returned again with a bit of a vengeance - because they didn't raise interest rates high enough (?). What are we doing at the moment? We're beginning to raise interest rates, but we're scared - the US has 30 trillion in debt. Interest rates force their demise. Therefore war - more money printing, more inflation, but we can literally destroy assets to solve the problem. Nothing like a rebuild to boost productivity. We could "Build Back Better" :P
Take your pick, you decide. I'm not telling you how it will be - this is a graph, not a crystal ball - I'm just showing you how it has been in the past. History doesn't repeat, but it rhymes. This will be an interesting decade.